Water Quality Monitoring
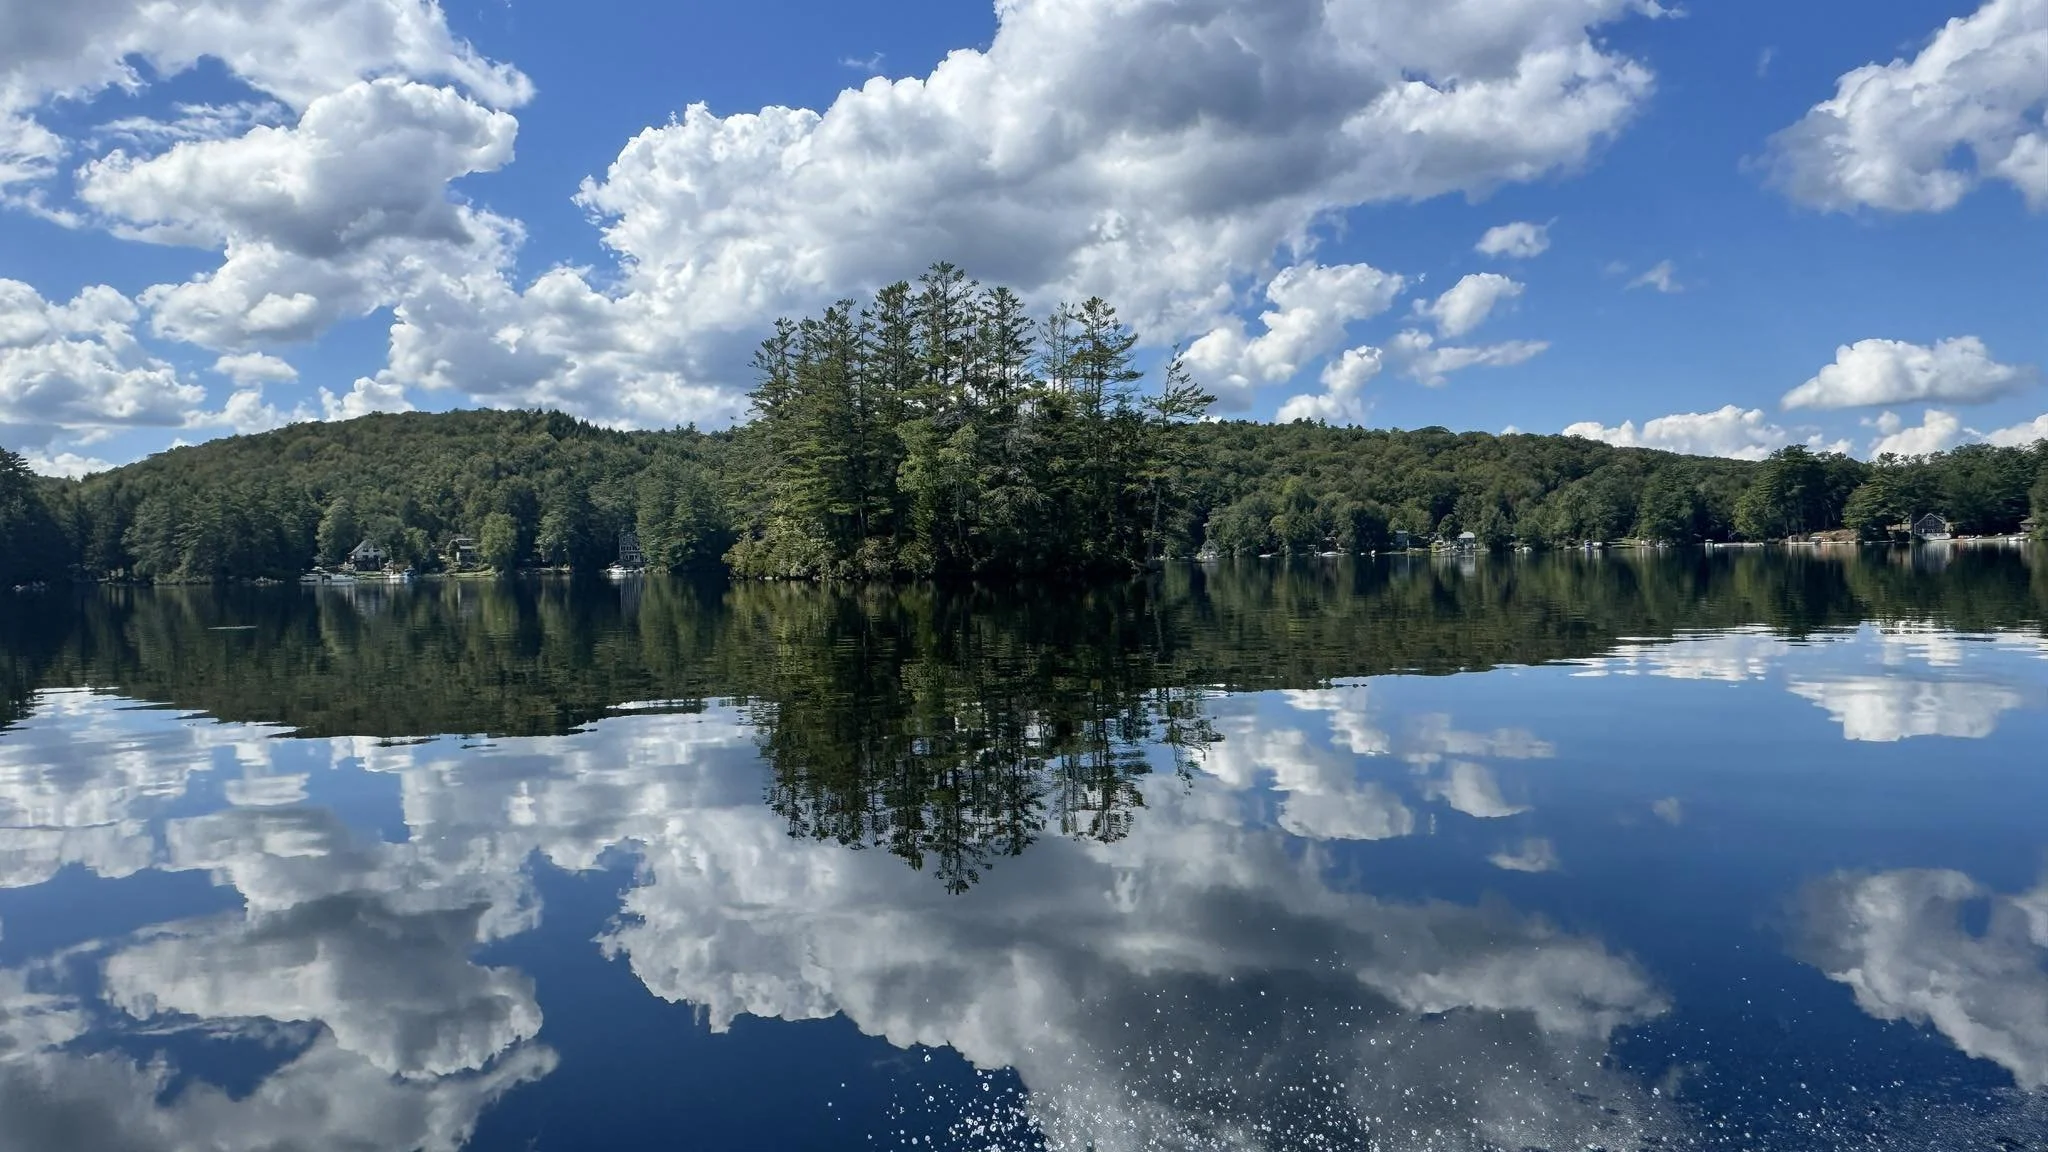
We’re proud of Crystal Lake’s clear water. We test and monitor the lake regularly, using the results to track changes and guide our conservation efforts.
Current Water Quality Protect Your Lake Lake Smart Septic Safe
Current Water Quality Conditions
We are fortunate to enjoy Crystal Lake’s pristine water and thriving ecosystem, which support wildlife and provide valuable recreational opportunities for the Upper Valley community. To ensure these benefits persist for future generations, ongoing stewardship is essential as environmental changes, including climate change, continue to affect New Hampshire’s lakes.
The information on these pages is provided to inform and empower our community to protect Crystal Lake. In recent years, stronger storms and heavy rainfall have affected all lakes’ water quality, underscoring the importance of improving stormwater runoff management throughout our watershed. Together we can take practical steps to preserve and enhance the health of Crystal Lake.
Over 30 years of data, collected by Glyn Green and residents of Crystal Lake, show that Crystal Lake water quality remains high. This monitoring is made possible by volunteers, which could be you! Learn more about volunteering.
Data collection was performed following the guidance of the UNH Lakes Lay Monitoring Program and the New Hampshire Department of Environmental Services (NHDES)

| Parameter | Crystal 2025 Lake Avg (range) |
Oligotrophic "Excellent" |
Mesotrophic "Fair" |
Eutrophic "Poor" |
|---|---|---|---|---|
| Total Phos (ppb) | 7.3 (6.5 - 8.5) |
< 8 | 8 - 12 | > 12 |
| Chlorophyll (ppb) | 1.6 (0.7 - 2.3) |
< 3 | 3.3 - 5.0 | > 5.0 - 11.0 |
| Water Clarity (m) | 5.0 (3.0 - 6.5) |
> 5 | 2.0 - 5.0 | < 2.0 |
| Dissolved Oxygen (ppm)¹ | 1.8 (0.0 - 4.0) |
> 5 | 2.0 - 5.0 | < 2.0 |
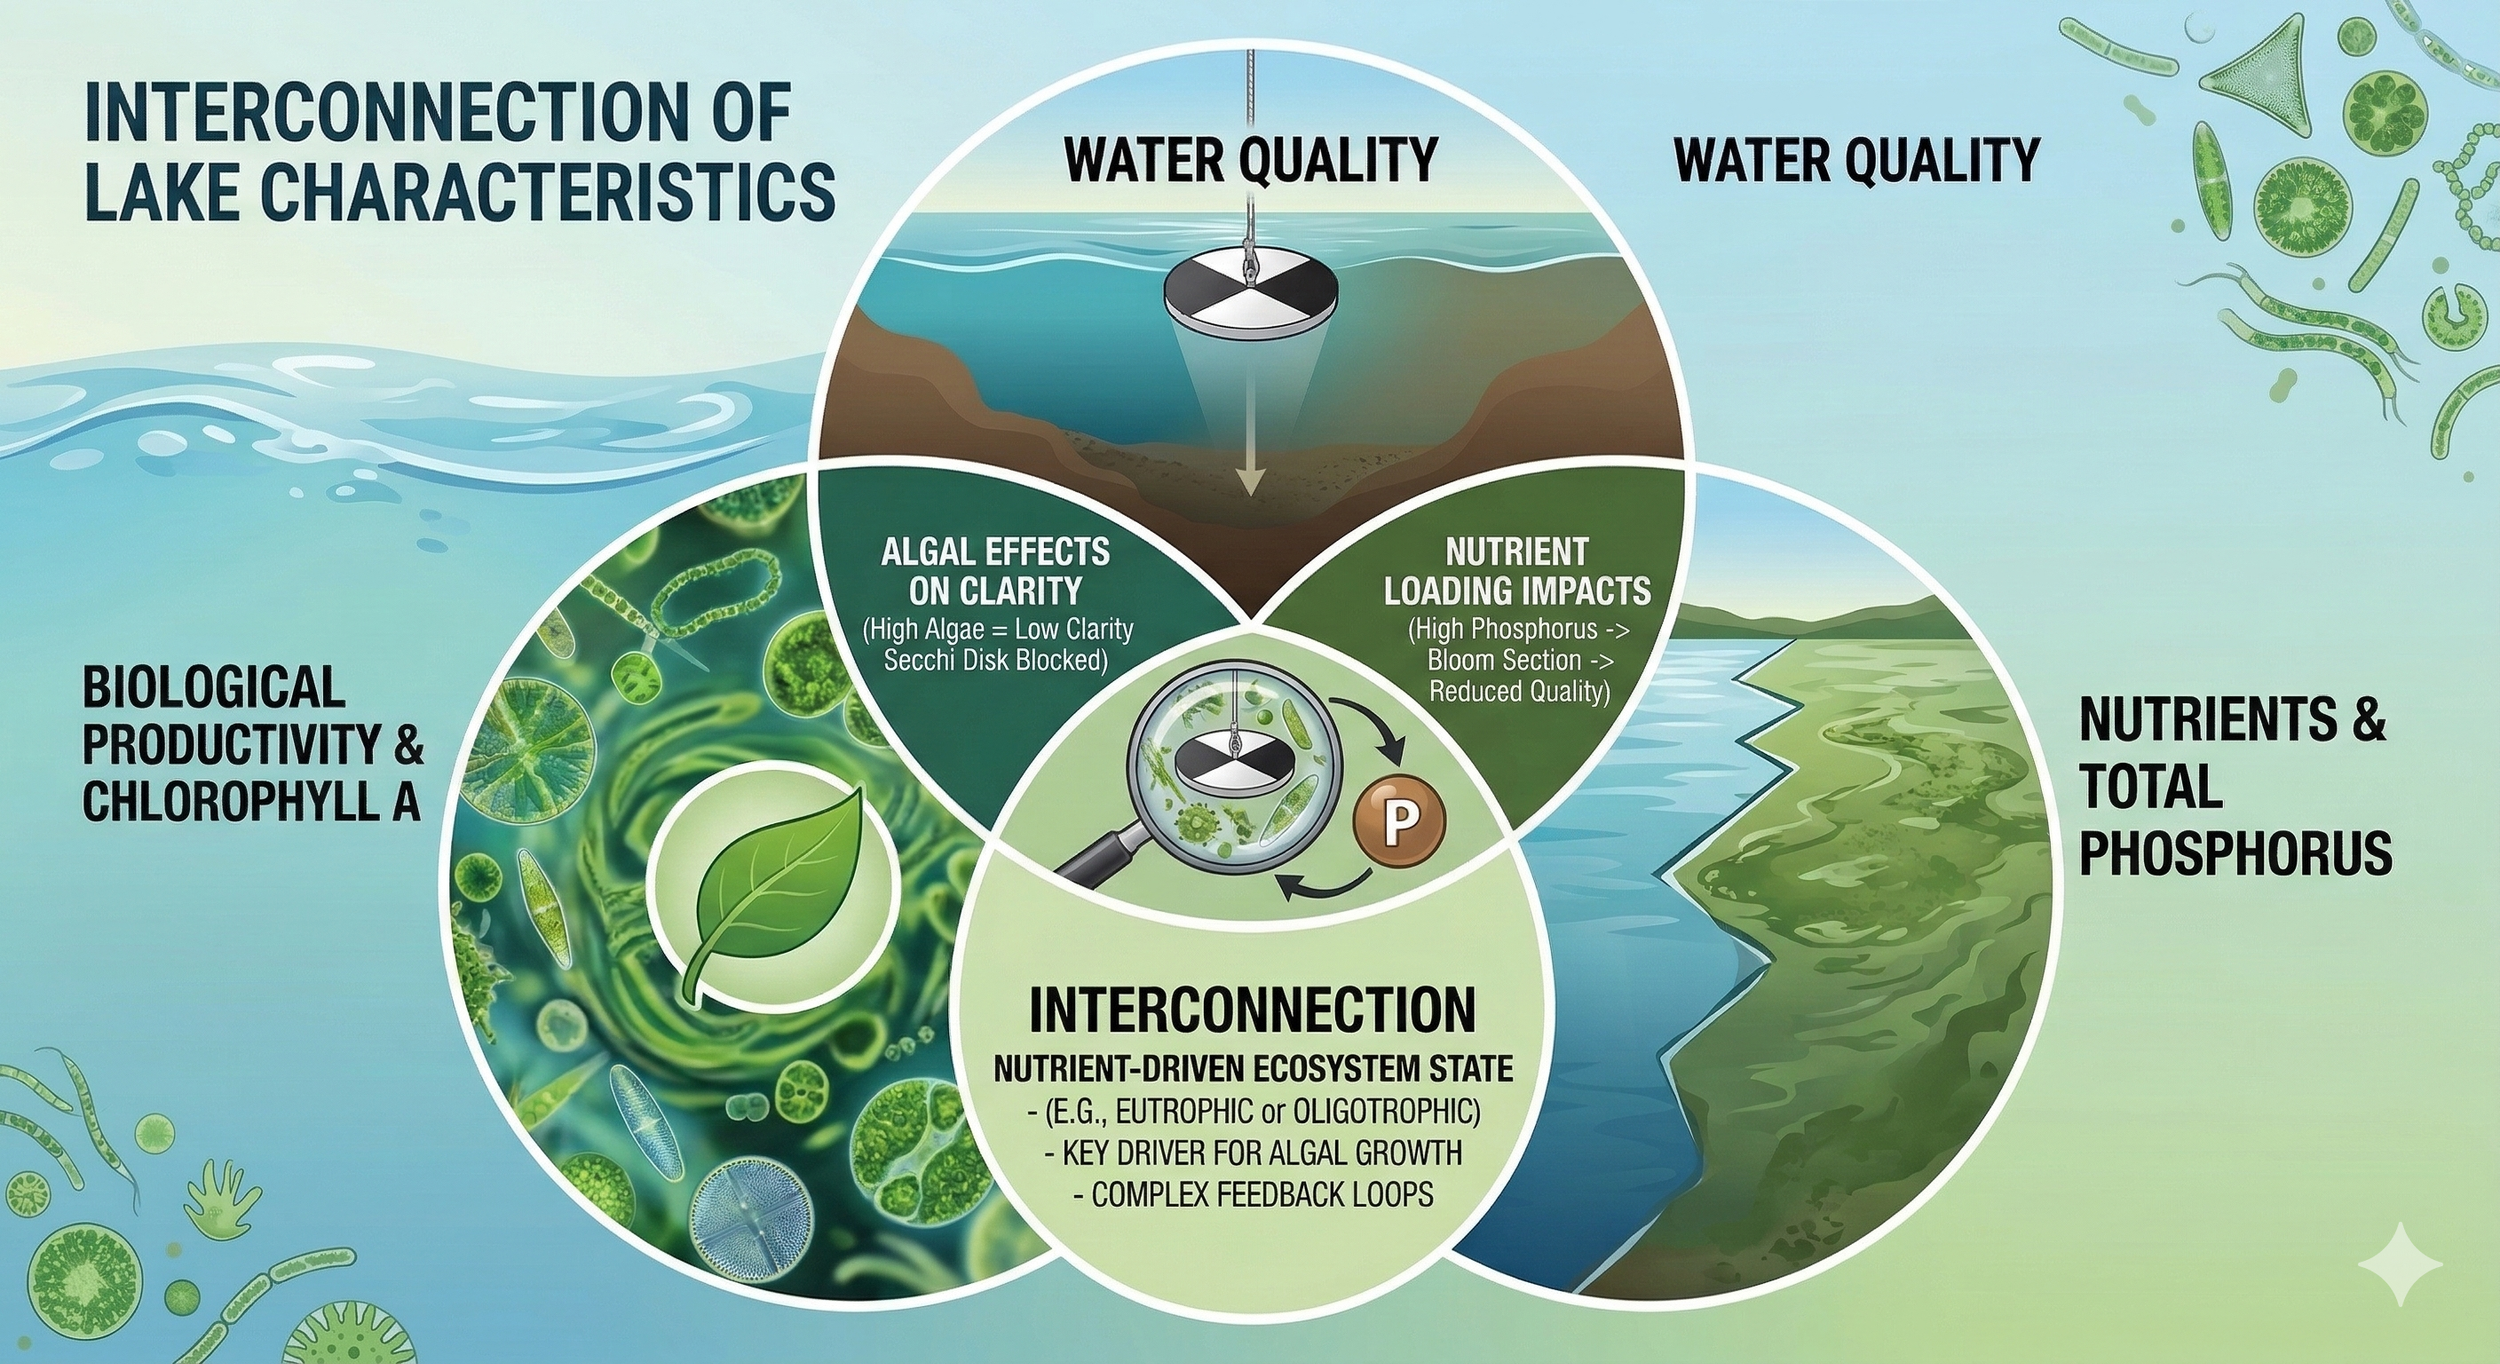
Long-Term Trends
Crystal Lake’s deepest point best represents the lake-wide trends in water quality. We look at data from the “Deepest point” for long-term trends to understand what is happening in the lake over time.
Water Clarity
Chlorophyll a
Total Phosphorus
Water Clarity
Water clarity is measured using a black-and-white Secchi disk, lowering it until it’s no longer visible. The deeper the disk travels, the clearer the water, a sign of low levels of pollutants and algae. If visibility changes, we can identify red flags like increased algae growth, stormwater runoff, or new pollution sources.
Water Clarity Trends
-
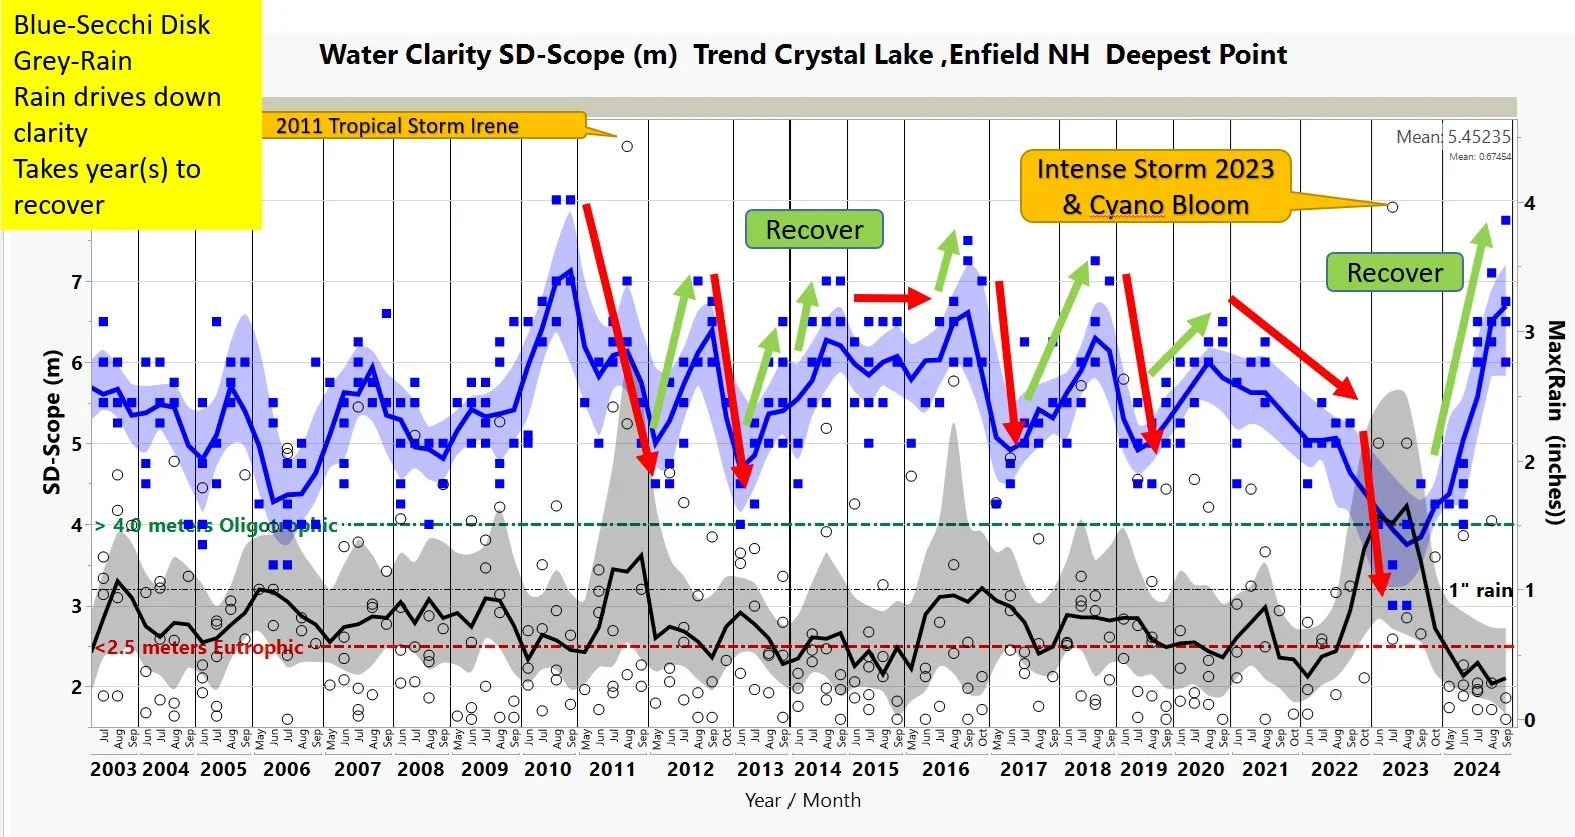
This figure shows individual readings of water clarity (blue squares) and rainfall (white circles) taken from 2003 to present. The solid lines (blue and black) are statistically fitted trendlines, and the shadings represents how well the trendlines fit the data.
This figure demonstrates that big storm events lead to decreased water clarity. This could happen because stormwater runoff brings sediment and nutrients into the lake, causing algal blooms.
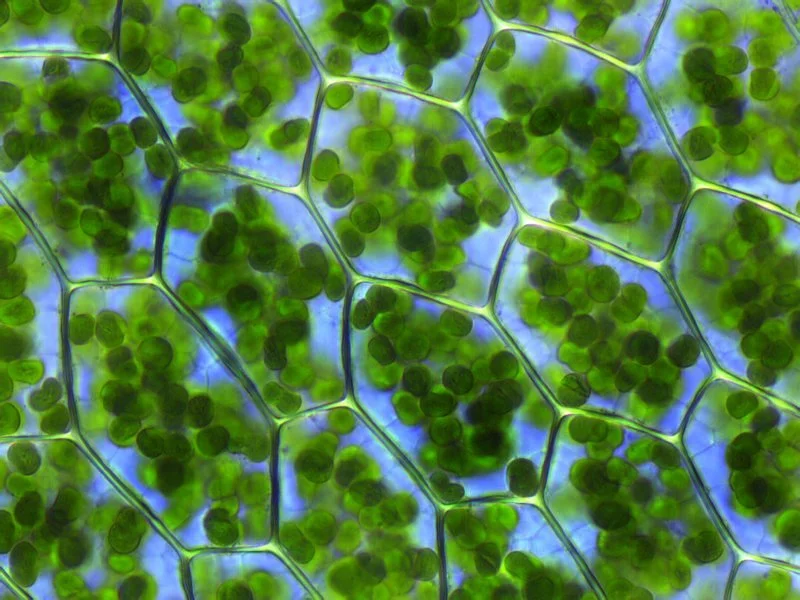
Chlorophyll α
Chlorophyll α is the light-absorbing pigment found in all green plants and algae (cyanobacteria) that converts the sun’s energy into food through photosynthesis. It’s what makes them green! Levels below 3.3 parts per billion (ppb) are considered “oligo”.
Chlorophyll α Trends
-
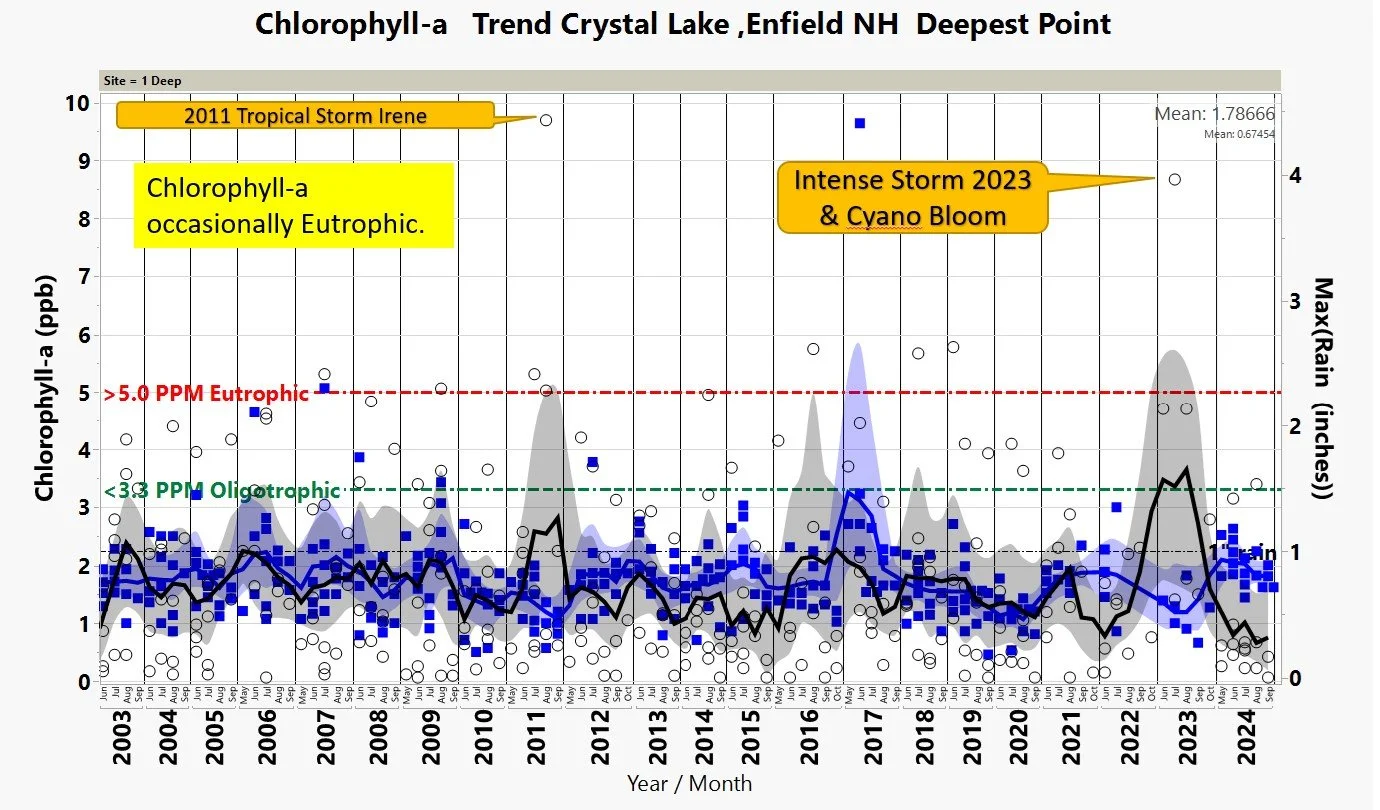
This figure shows individual readings of chlorphyll α (black dots). and rainfall (white circles) taken from 2003 to present. The solid lines (blue and black) are statistically fitted trendlines, and the shadings represents how well the trendlines fit the data.
This figure demonstrates that big storm events lead to decreased water clarity. This could happen because stormwater runoff brings sediment and nutrients into the lake, causing algal blooms.
Total Phosphorus
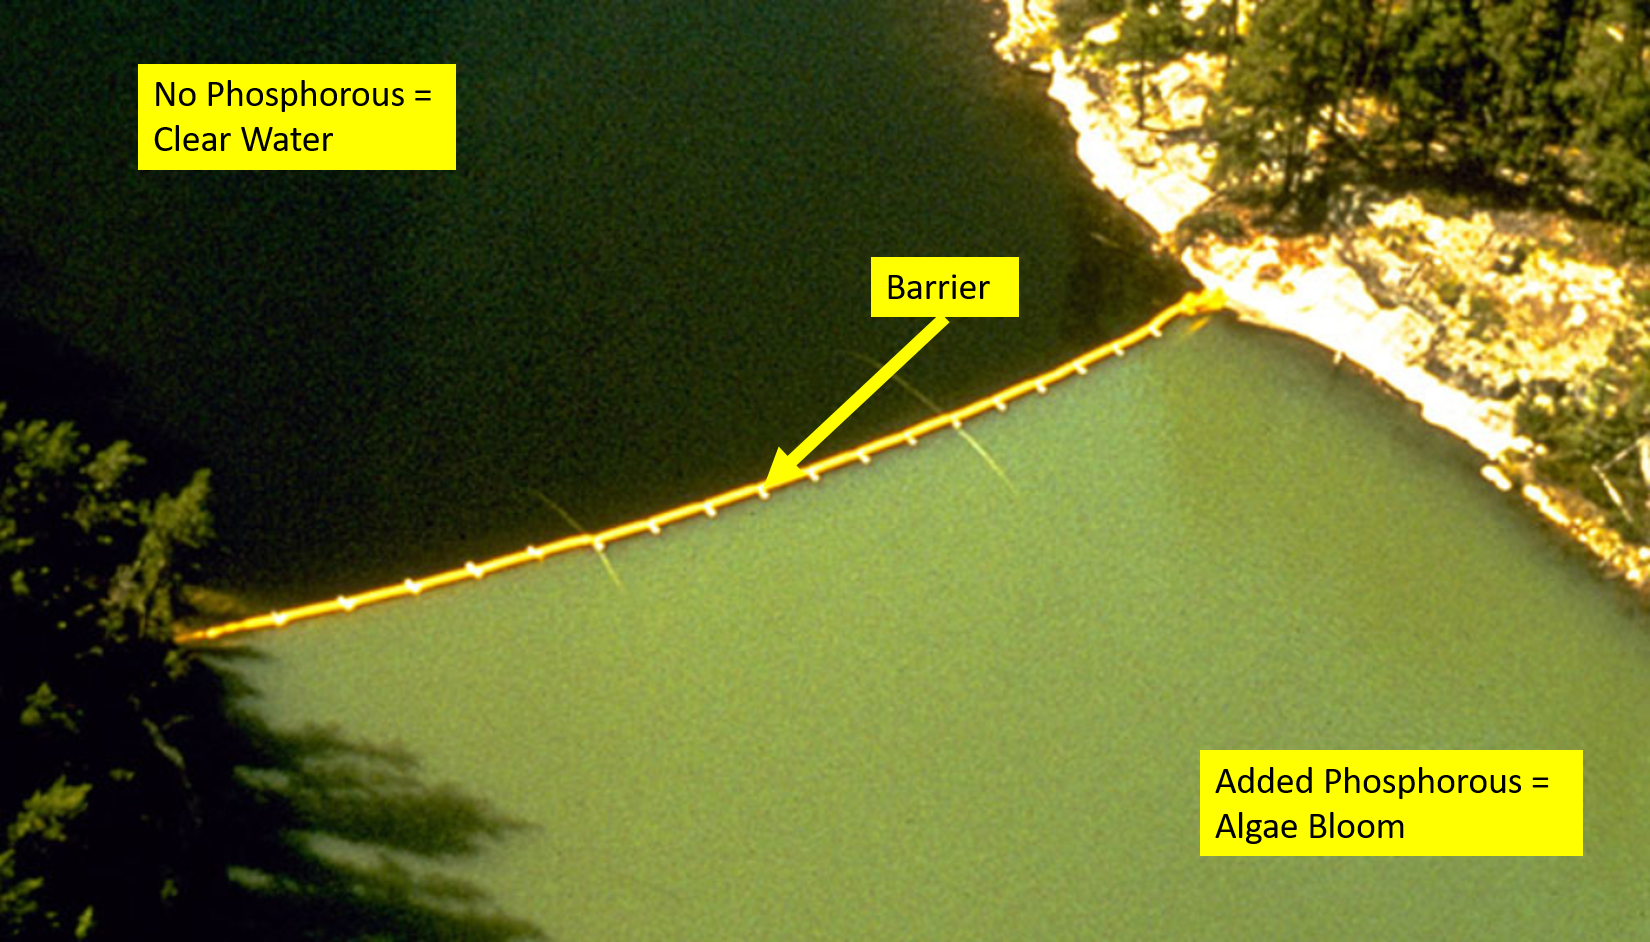
Phosphorus acts as the primary “fuel” for the growth of freshwater plants and algae, such as toxic cyanobacteria. While it occurs naturally in the ground, human activities like fertilizer application and failing septic systems can accelerate it’s build up in lakes.
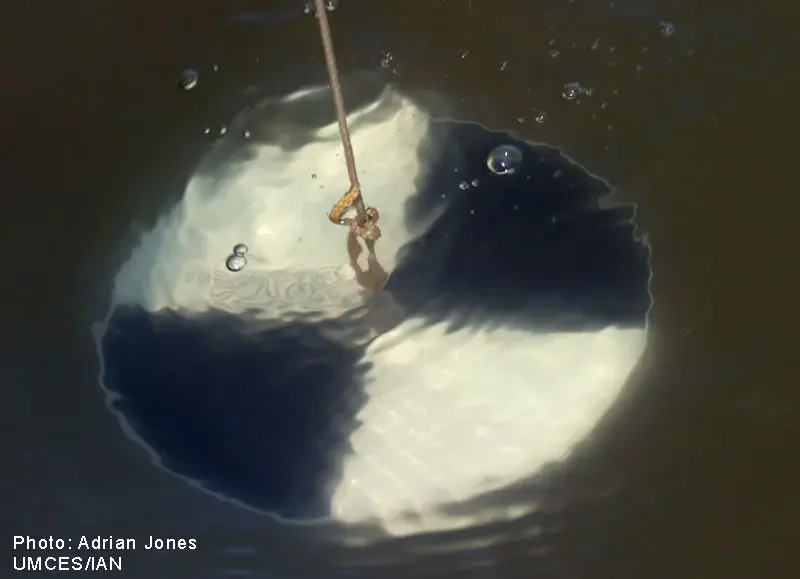
In an experiment in Canada (Schindler, 1973, see photo), scientists created a large algae bloom by adding phosphorus to one side of a divided lake (bottom green water). The other side of the lake without added phosphorus stayed clear (top dark water).
Hardscaping of driveways and roads (impervious surfaces) can concentrate stormwater runoff, leading to increased erosion and more phosphorus in the lake. More phosphorus in the water leads to increased algae and decreased water quality.
Total Phosphorus Trends
-
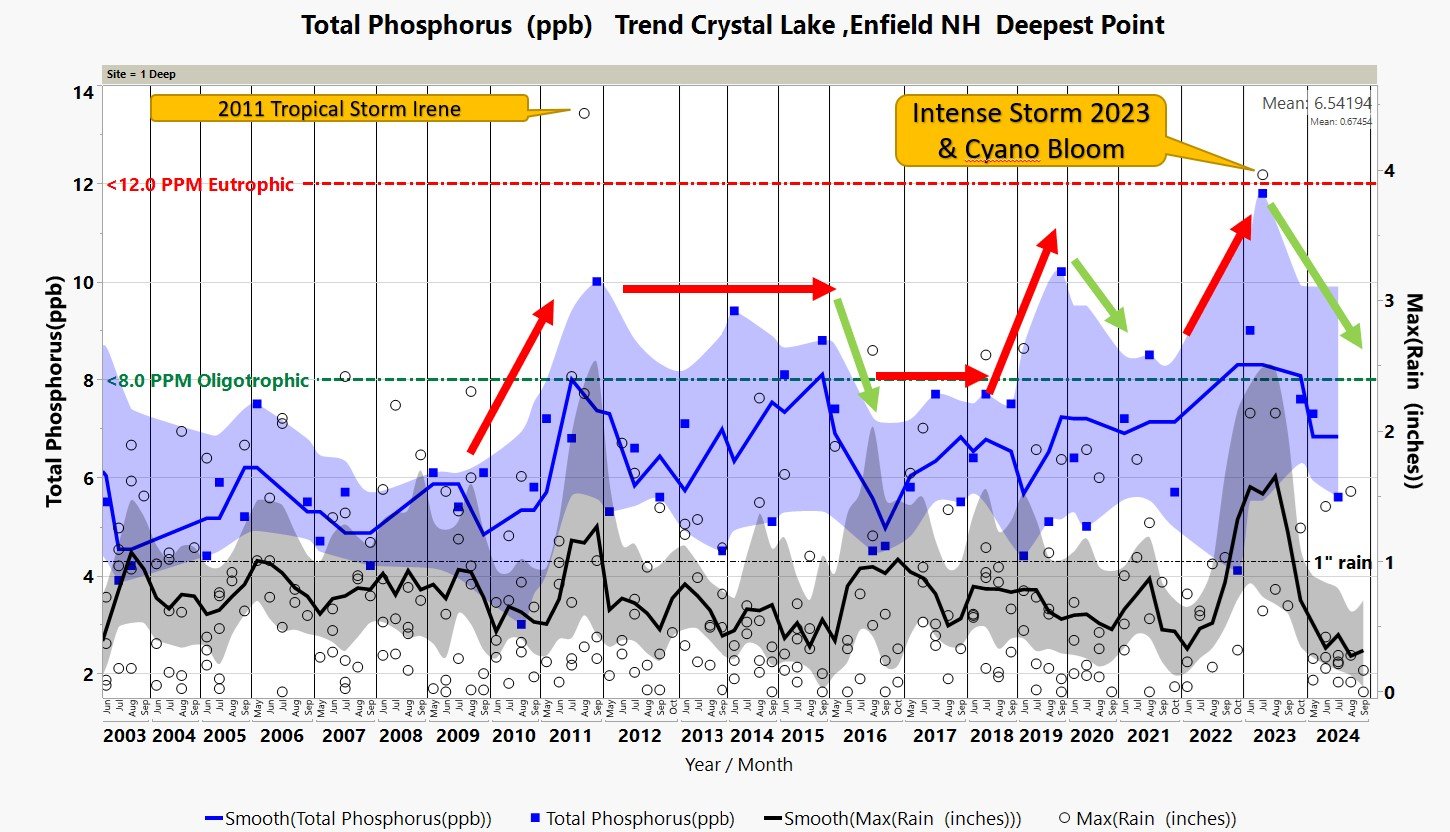
This figure depicts phosphorus measurements (blue squares) and rainfall amounts (white circles) from 2003 to 2024. It demonstrates that big storm events lead to increased phosphorus concentration in the lake. The excess nutrients can lead to algal blooms and decreased water quality.